title: "Sales Intelligence From 47 PowerPoints: Extracting ICP Signals Your Vendors Can't Sell You" slug: powerpoints-to-gtm-data seo_keyword: "sales intelligence" meta_description: "Sales intelligence from 47 PowerPoints: 3-stage extraction pipeline for a PE-backed industrial company. 4 ICP signals no vendor database contains." og_description: "I extracted structured ICP signals from 47 sales presentations at a PE-backed industrial company. The pipeline found messaging drift, competitive positioning gaps, and pain patterns the team used intuitively but never documented." cluster: ai-for-gtm author: Victor status: published published_date: 2026-03-26 read_time_minutes: 14 description: "Sales Intelligence From 47 PowerPoints: Extracting ICP Signals Your Vendors Can't Sell You" domain: steepworks type: article updated: 2026-03-26
Sales Intelligence From 47 PowerPoints: Extracting ICP Signals Your Vendors Can't Sell You
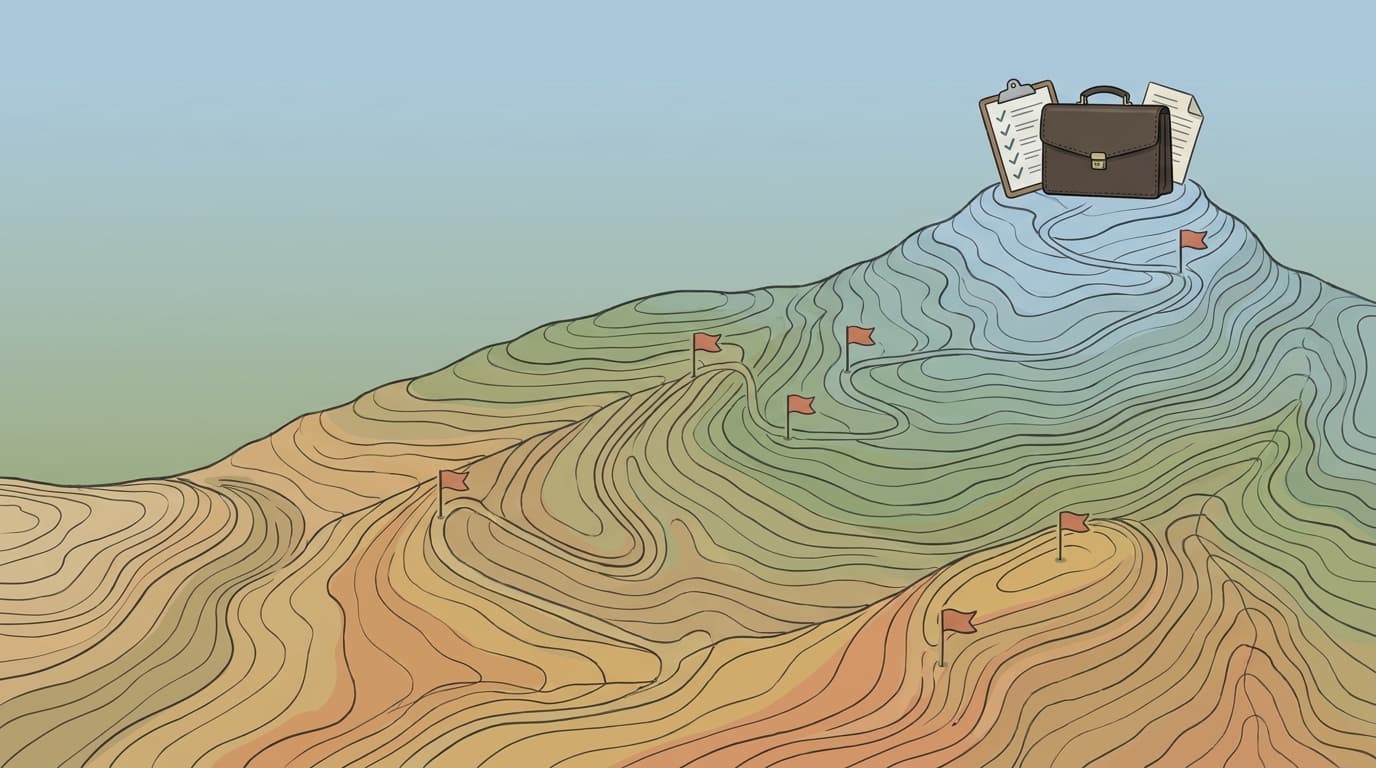
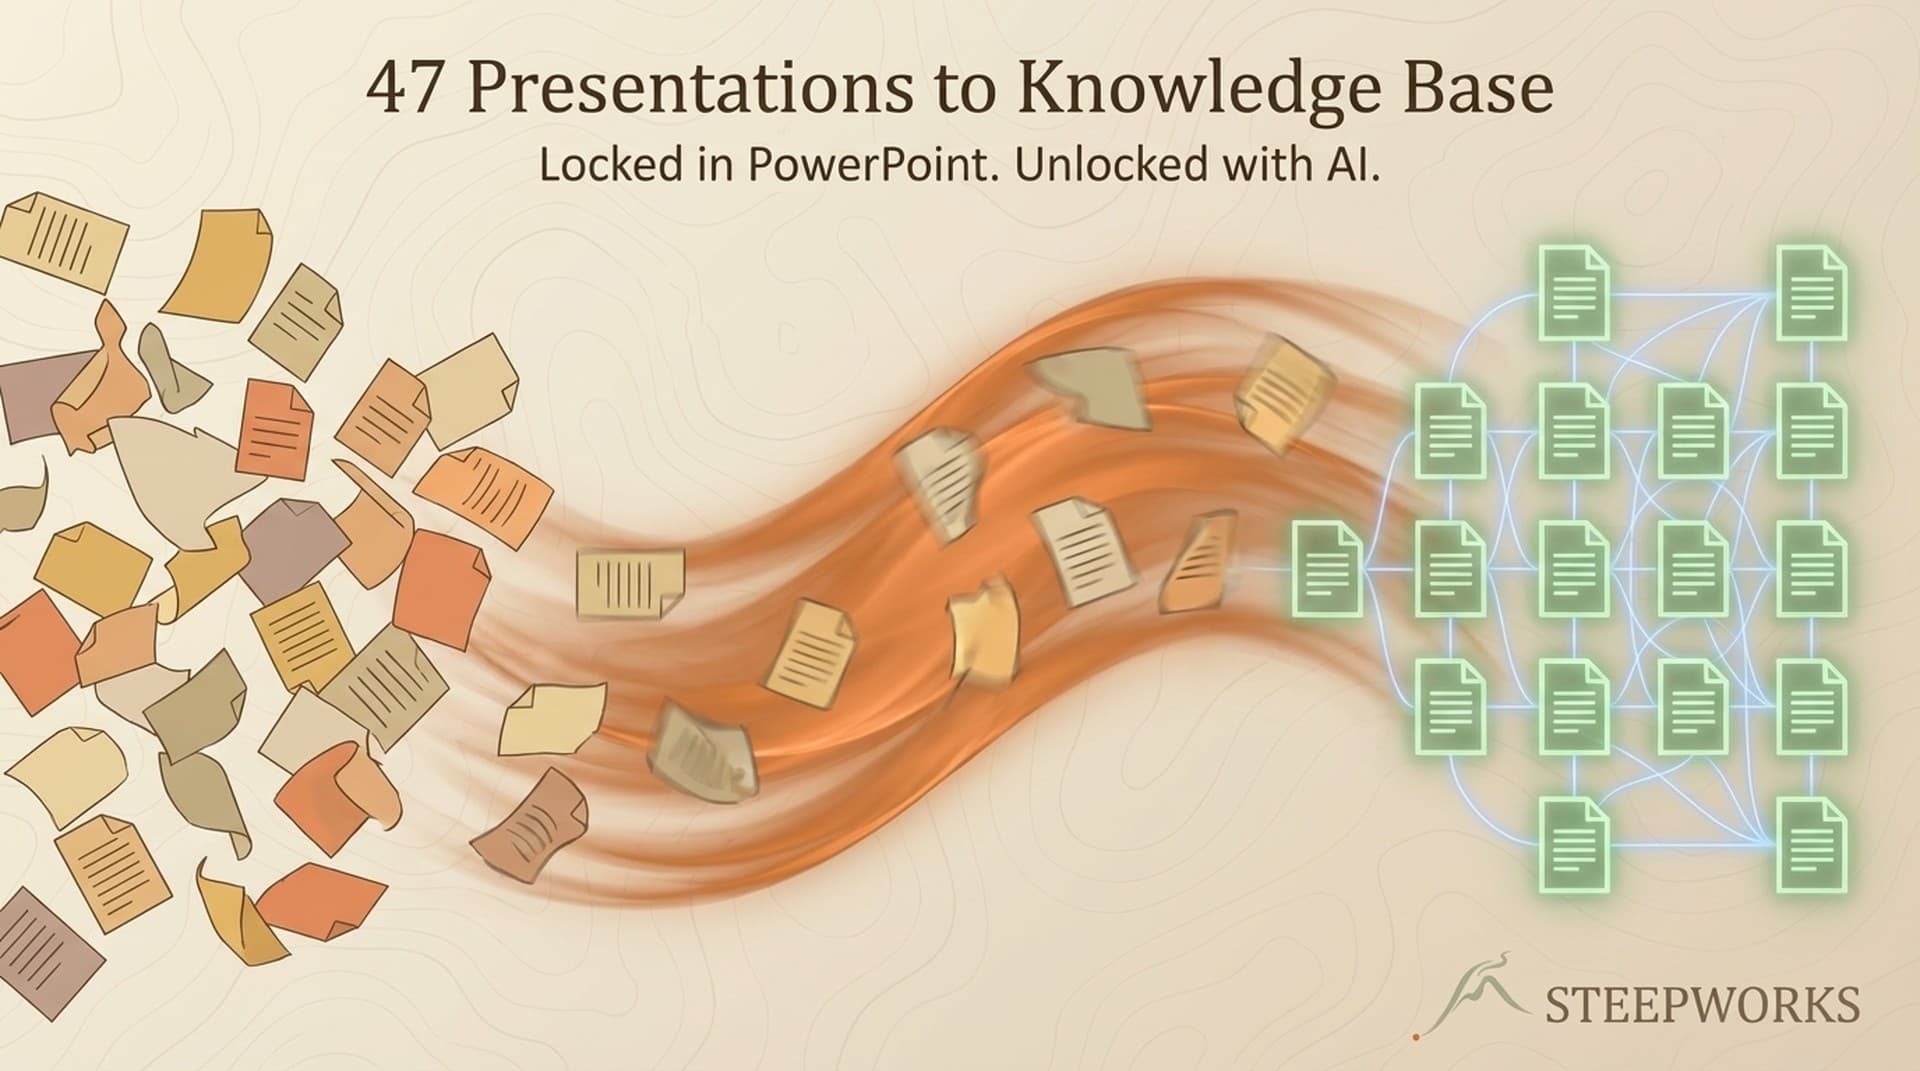
A PE-backed industrial company hired me to sharpen their go-to-market. When I asked about their customer data, the executive pointed me to a shared folder. Inside: 47 sales presentations, strategy decks, and customer-facing materials -- roughly 2GB of accumulated knowledge spanning years of sales conversations, competitive positioning, and customer interactions. All of it locked in PowerPoint and PDF files that nobody had time to read, let alone analyze.
That folder was a sales intelligence goldmine hiding in plain sight.
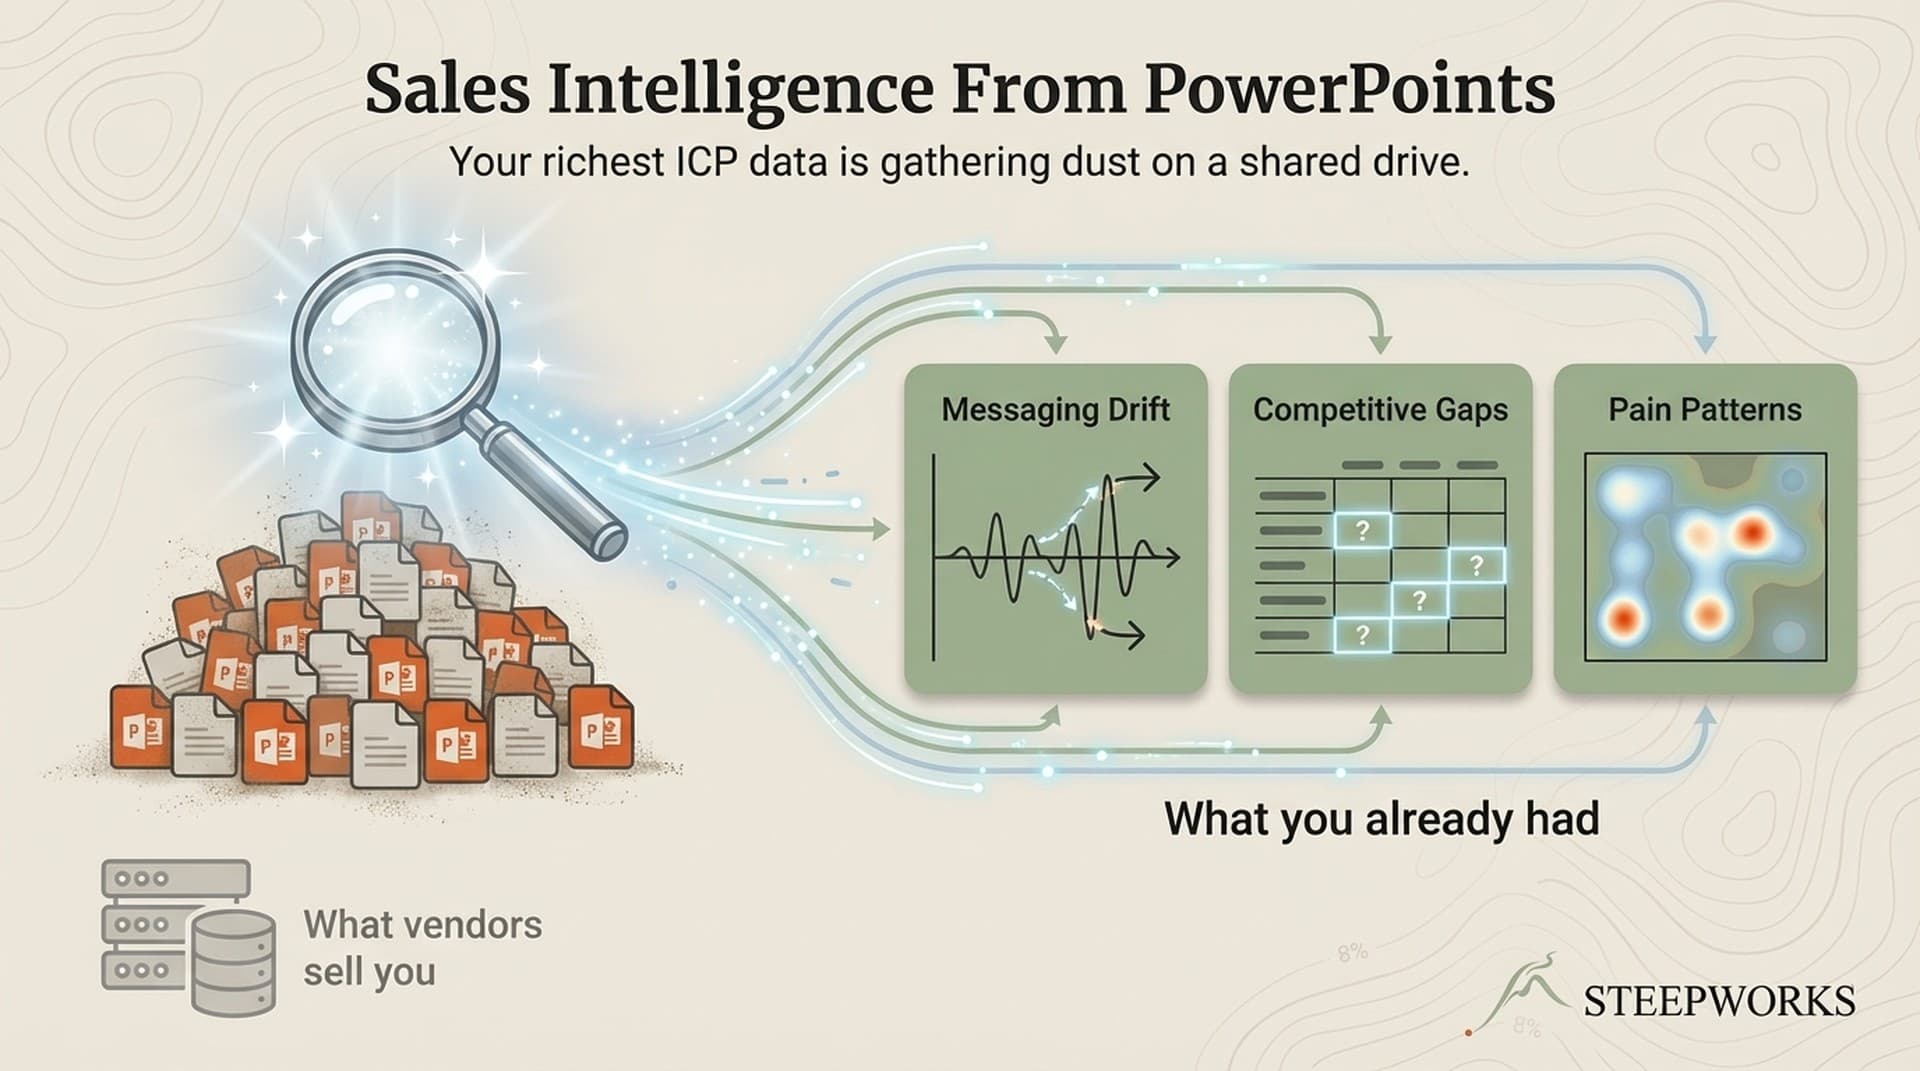
The sales intelligence market is projected to reach $10.25 billion by 2032. Most of that spend goes to external data -- intent signals, firmographic enrichment, contact databases. All valuable. But all incomplete. The richest source of ICP signal at most companies isn't a vendor database. It's the accumulated knowledge your team has been creating for years, locked in formats nobody can query.
Sales decks are strategic artifacts. Every presentation your team builds encodes decisions about who you sell to, what problems you lead with, how you position against competitors, and what language you've tested against real buyers. When those artifacts span years and dozens of customer interactions, the patterns across them tell you things no external data provider can.
Your version of this might be 200 pitch decks in Google Drive, three years of QBR presentations in SharePoint, or your founder's original sales narrative that nobody has revisited since Series A. The format differs. The buried intelligence is the same.
What you'll find in this article: How to extract four categories of intelligence from your existing sales materials: (1) pain pattern frequency -- which customer problems your team actually emphasizes vs. which ones marketing thinks they emphasize, (2) competitive positioning drift -- how your story about why-you're-different has shifted over time, (3) messaging inconsistencies -- where different reps tell different stories about the same capabilities, and (4) ICP signals -- which customer segments, use cases, and buying triggers appear most frequently across your materials.
I'm going to walk through the actual extraction pipeline I built, what we found in those 47 decks, and how to build your own version -- whether you have Python skills or just a Claude subscription.
Why Sales Decks Are an Untapped Sales Intelligence Source
Most teams treat sales presentations as disposable. You build a deck for a prospect meeting, deliver it, file it, forget it. Maybe a new rep copies an old deck and modifies it. The originals accumulate in shared drives like geological strata -- each layer recording what the team believed about its market at that moment in time.
That accumulation is the point. A single deck is a snapshot. Forty-seven decks are a dataset.
Three Categories of Buried Intelligence
Language patterns and pain articulation. Every sales deck contains the language your team uses to describe customer problems. Across 47 decks, the same pains were described differently -- sometimes subtly, sometimes wildly. The aggregate pattern tells you which pains your team actually leads with (regardless of what the official messaging says) and which language has survived enough iterations to qualify as battle-tested.
This matters because the language your sales team gravitates toward in customer-facing presentations is often closer to what resonates than the language marketing crafted in a conference room. The decks are a record of what your team learned in the field, even if they never wrote it down.
Competitive positioning decisions. Sales presentations are where competitive positioning gets honest. Not the polished battlecard from product marketing -- the actual slide where an AE explains to a prospect why your solution beats the alternative. Across dozens of decks, you can see which competitors your team actually positions against (vs. which ones the competitive analysis says you should), how the positioning has evolved, and where gaps have emerged that nobody noticed because the drift happened one deck at a time.
Messaging drift over time. This is the finding most teams don't expect. When you lay 47 presentations on a timeline, you can see your company's story evolving -- sometimes intentionally, sometimes through accumulated improvisation. Capabilities that were central in Year 1 had disappeared by Year 3. New value props had crept in without anyone consciously adding them. The drift itself is intelligence -- it tells you where the market pulled your positioning vs. where leadership pushed it.
Why Gong and Clay Don't Cover This
If you're thinking "my tools already handle this," pause. The distinction matters.
Gong captures what your team says in conversations -- unscripted, reactive, in-the-moment. Invaluable for understanding how deals actually unfold. Clay and enrichment tools capture what's true about companies -- firmographics, technographics, intent signals. Invaluable for targeting and prioritization.
Sales presentations capture something different: what your team deliberately chose to communicate. The curated, strategic narrative about who you are, who you serve, and why you matter. This reflects organizational strategy decisions, not individual conversations or external data points.
The gap nobody is mining is the strategic layer. The deliberate positioning decisions your team made, revised, and evolved across dozens of customer interactions -- that sits between "what we said on a call" and "what's true about the prospect." Platforms that convert unstructured sales data into insights focus almost exclusively on conversation recordings. The document layer -- the curated strategic artifacts -- remains untouched.
If your team has built more than 20 customer-facing presentations, you have a pattern analysis opportunity. The threshold isn't high. It's just that nobody thinks of sales decks as a data source.
The Extraction Pipeline: From Binary Files to Structured Sales Intelligence
The architecture has three stages. I'll walk through each, then give you the scrappy version that doesn't require Python.
Stage 1: Text Extraction (Binary to Readable)
PowerPoint files (.pptx) and PDFs are binary formats. You can't search across them, compare them, or run pattern analysis on them without first extracting the text.
We used python-pptx and PyPDF2 -- straightforward Python libraries that pull text content from slides and pages. The output: raw text files, one per presentation, preserving slide structure. Speaker notes extracted separately from slide content, because the notes often contained the real reasoning behind what appeared on the slide.
The extraction itself took about two hours for 47 files. Not glamorous, but necessary. The alternative is reading 47 presentations manually, which is what nobody had time to do -- which is why the intelligence was still buried.
Stage 2: Markdown Conversion (Readable to Structured)
Raw extracted text is messy. Bullet points without hierarchy, speaker notes mixed with slide content, chart labels without context. The conversion step adds structure: headings from slide titles, bullet hierarchies preserved, metadata (date, audience, presentation type) tagged consistently.
This is where AI assistance actually earns its keep. An LLM can take raw extracted text and restructure it into clean markdown with consistent formatting across all 47 documents. The key design decision: every document must follow the same structure so cross-document analysis works. We used a structured extraction prompt that enforced consistent output -- pain points tagged as pains, competitive mentions tagged as competitive, capability claims tagged as capabilities. Same taxonomy, every document.
Building the extraction prompt is a skill in its own right. The prompt needs to be instruction-heavy, not goal-first -- you want reliable, consistent structured extraction across 47 documents, not creative interpretation. Each document should produce the same output schema. Inconsistent extraction at this stage poisons every downstream analysis.
Stage 3: Pattern Analysis (Structured to ICP Signals)
With 47 structured documents in a common format, you can now run pattern analysis: frequency of pain points mentioned, competitive claims by competitor and by time period, capability descriptions and how they've evolved, customer segment references and their frequency.
This is the step where the intelligence emerges. Not from any single presentation -- from the patterns across all of them. We ran the analysis both programmatically (counting frequencies, clustering similar language) and with AI-assisted synthesis (identifying themes, spotting evolution patterns, flagging inconsistencies).
The synthesis step chains naturally: extract structured signals from each document first, then run cross-document pattern analysis on the aggregate. It's the same principle behind any knowledge synthesis workflow -- parallel extraction with consistent schemas, followed by synthesis across the corpus.
Why This Isn't Just "Upload to ChatGPT"
You could upload each deck to ChatGPT and ask "what are the key themes?" You'd get 47 individual summaries. Useful, but not intelligence.
What you would not get is cross-document pattern analysis: which pain points appear in 80% of decks vs. 20%. Which competitive claims evolved over time. Which customer segments stopped appearing after a certain date. Which messaging survived multiple revisions (indicating it works) vs. which messaging appeared once and disappeared (indicating it didn't).
The intelligence lives in the patterns across documents, not within any single one. That requires structured extraction into a common format where comparison is possible -- not 47 separate conversations with an AI.
The Scrappy Version (No Python Required)
For teams without engineering support:
- Export each presentation to PDF (if not already).
- Upload 5-10 at a time to Claude or ChatGPT with a structured extraction prompt: "For each presentation, extract: (a) customer pains mentioned, (b) competitors referenced, (c) capabilities claimed, (d) customer segments targeted. Output as a table."
- Combine the tables into a single spreadsheet.
- Sort and filter to find patterns: frequency, evolution over time, inconsistencies.
The scrappy version gets you 60-70% of the insight at 20% of the effort. The scripted pipeline is better for 30+ documents where manual table-combining becomes unwieldy. But don't let perfect be the enemy of useful -- five hours with the scrappy version will still surface patterns you didn't know existed.
What We Actually Found: ICP Signals From 47 Presentations
The extraction took about a week. Here's what the pattern analysis surfaced.
Finding 1: Pain Pattern Frequency (The Gap Between Marketing and Sales)
Three core customer pains appeared across the majority of presentations -- but they weren't the three pains that marketing had formally documented. There was overlap, but the emphasis was wrong. The pain the sales team led with in 78% of presentations wasn't the one marketing considered the primary value proposition. Marketing led with a capability-first message. Sales led with a problem-first message. Both were correct. They were just solving for different audiences -- marketing was writing for the website visitor, sales was speaking to the decision-maker in the room.
When you can show that three-quarters of presentations lead with pain A while the website leads with pain C, you have an evidence-based case for messaging realignment -- not a gut-feel argument. (professional setup services)
Your version: Pull your last 20 pitch decks. What pain does your team actually lead with? Compare it to your homepage headline. If they match, your messaging is aligned. If they don't, your sales team has already discovered what actually resonates -- and your marketing hasn't caught up. (See also: icp model)
Finding 2: Competitive Positioning Drift
Competitive positioning varied significantly across decks. Different presentations emphasized different differentiators against the same competitors. Some decks positioned on speed-to-production. Others positioned on cost. Others on technical capability. The inconsistency wasn't random -- it correlated with the audience type and the time period. (See also: research prospect)
More revealing: the competitive claims evolved over time without any formal decision to change positioning. The team had organically shifted their story as they learned what resonated -- but the shift was never captured in the official battlecards. The official competitive positioning was roughly 18 months behind what the sales team had learned in the field. (evaluating a consultant)
Eighteen months. That's how long the gap was between what the sales team had figured out and what the rest of the organization believed. That gap existed not because anyone was hiding information, but because nobody had a mechanism to extract aggregate patterns from individual sales presentations.
Your version: Check whether your team is telling the same story about why you're different from your top competitor. Pull 10 recent pitch decks and compare the competitive slides. The variance will tell you whether your positioning is a strategy or a suggestion.
Finding 3: Customer Segment Signals
Certain industries and use cases appeared far more frequently than others -- not because anyone had made a targeting decision, but because those segments kept buying. The presentations reflected where the company was winning, even though the official ICP hadn't been updated to reflect it.
Conversely, segments that appeared in early presentations had disappeared entirely from recent ones. The market had signaled which segments were viable, and the sales team had responded -- but this intelligence existed only in the aggregate pattern across presentations, not in any single document or CRM report.
Gartner reports that only 42% of companies have a formally documented ICP. For the other 58%, the ICP lives in the accumulated decisions your sales team has made about who to pursue and how to position. Those decisions are encoded in your sales presentations. Extracting them gives you a documented ICP built from field evidence, not conference room assumptions.
Your version: Which customer types keep showing up in your presentations? That's your revealed ICP -- the one your sales team has discovered through trial and error. Compare it to your documented ICP. The delta is actionable.
Finding 4: Messaging Inconsistency as a Diagnostic Tool
This was the most unexpected finding. Where messaging was consistent across presentations, it indicated validated, battle-tested positioning. The team had converged on language that works.
Where messaging was inconsistent, it indicated an unresolved positioning question. The team hadn't figured out how to talk about that capability or that use case yet -- which often meant the ICP for that segment was still hypothesis rather than conviction.
Inconsistency, mapped systematically, became a diagnostic tool. It showed us where the company's ICP understanding was strong (consistent messaging, clear pain language, stable competitive positioning) and where it was still forming (varied language, shifting emphasis, multiple competing narratives). The inconsistency map was arguably more valuable than the consistency findings -- it told us exactly where to focus the next round of ICP research.
From Extracted Signals to a Searchable Knowledge Base
The extraction is the project. The knowledge base is the system.
The Output Structure
Each extracted signal -- pain point, competitive mention, messaging claim, customer segment reference -- was tagged with: source deck, date, audience type, presentation context (sales pitch vs. strategy review vs. customer QBR), and frequency across the corpus.
The result was a searchable knowledge base the team could actually use. The sales lead could query: "Show me every pain point we've used in presentations for [specific segment] in the last 18 months." That's sales intelligence you can't buy from ZoomInfo or 6sense. The executive could query: "Which competitive claims have we stopped making? When did we stop?" That tells you where the market shifted and your team adapted -- intelligence that was trapped in PowerPoints until we extracted it.
Compounding Intelligence
This becomes an asset -- not a one-time exercise -- when you build it as a system. Every new presentation your team creates gets added to the corpus. The pattern analysis gets sharper with more data.
Quarterly extraction runs (add the last quarter's presentations, re-run the pattern analysis) turn this from a project into infrastructure. The knowledge base becomes the ground truth for messaging decisions. Instead of arguing about positioning in a meeting, you query the corpus: "What have we actually been saying? What's working?"
Apollo calls a modern ICP a "living data model" rather than a static document. That framing applies here. The extracted intelligence isn't a report you file away. It's a system that updates as your team produces new materials, continuously reflecting what you're learning about your market.
For how to build systems that compound intelligence over time, see our AI GTM Stack guide -- the architectural thinking behind connecting tools into systems that get smarter with each cycle applies directly.
What Sales Intelligence Vendors Miss -- And Where Internal Extraction Fits
External vs. Internal: Complementary Layers
External sales intelligence (6sense, Bombora, ZoomInfo, Clay) tells you what's happening outside your company: who's hiring, who's raising money, who's showing intent signals, who matches your firmographic criteria. Essential for targeting and prioritization.
Internal sales intelligence -- what I'm describing here -- tells you what's happening inside your company: what your team has learned about your market, your buyers, and your positioning through years of customer interactions. Essential for messaging, ICP refinement, and competitive positioning.
They're complementary layers. External data tells you who to target. Internal document analysis tells you what to say when you get there -- and whether your team is saying it consistently.
The vendors aren't wrong. External signals are genuinely valuable. But they're solving the external half. The internal half -- what your team has learned, how your positioning has evolved, where your messaging has drifted -- is already in your shared drive. You just need to extract it.
When to Run This Exercise
This isn't a daily workflow. It's a periodic exercise -- quarterly, or triggered by specific events.
Run it when:
- You acquire a company and inherit their sales materials
- You onboard a new head of sales who needs to understand how the team has been positioning
- You're redesigning your messaging and need evidence about what's been working
- You realize your ICP hasn't been updated in 18+ months and the market has moved
- You're preparing for a board meeting and need to show how your GTM story has evolved
Don't run it when:
- You have fewer than 15-20 presentations (not enough data for meaningful pattern analysis)
- Your team already has strong message discipline and consistent positioning (the extraction will confirm what you already know -- valuable but not urgent)
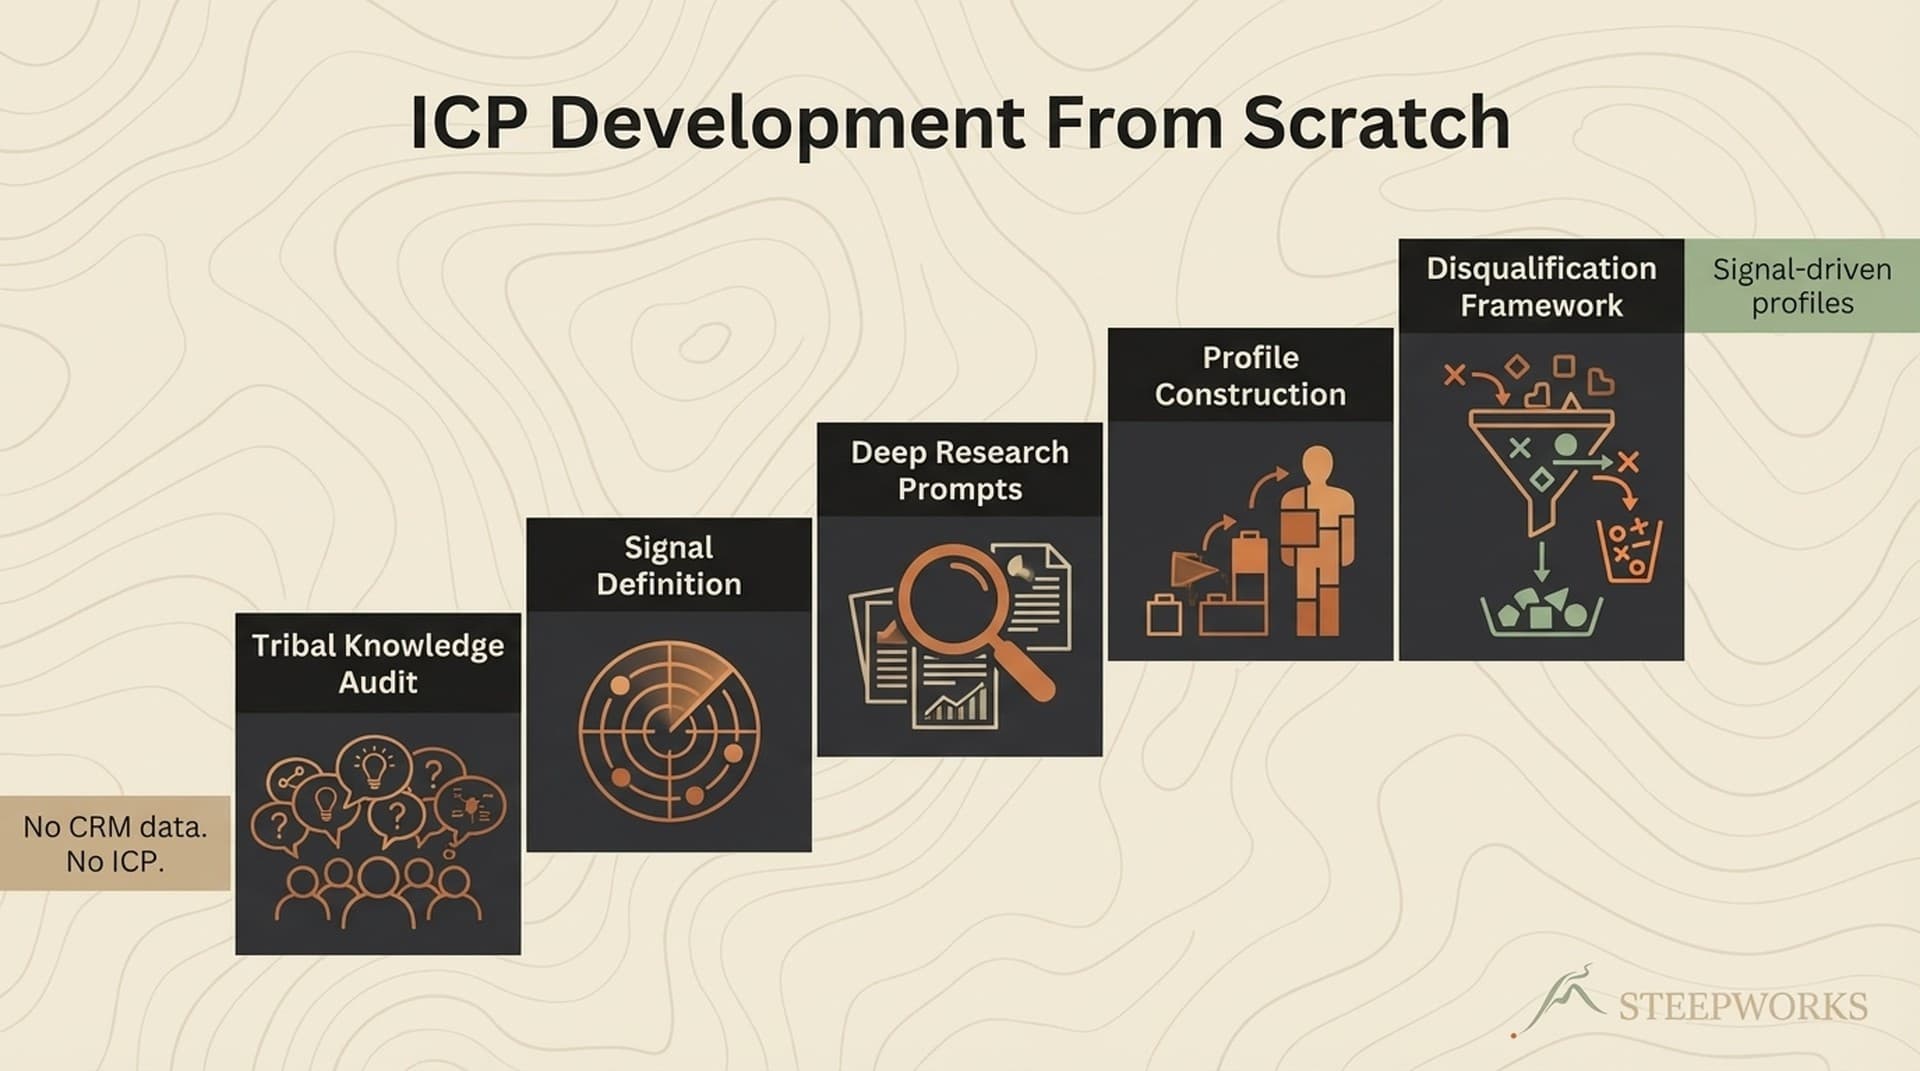
For the ICP development process that naturally follows this kind of extraction, see our field report on building an ICP from scratch at a PE-backed company. The PowerPoint extraction described in this article was Step 1 of that five-step process.
Beyond PowerPoints: The Full Internal Intelligence Stack
Sales decks are the most obvious starting point, but they're not the only internal source worth mining. The same extraction pipeline applies to call transcripts (if you have Gong or Chorus recordings, the transcripts contain patterns that aggregate analysis can surface), email threads with prospects (particularly the back-and-forth where objections get addressed), product marketing archival material (old positioning documents, messaging frameworks, launch materials), and website copy evolution (your homepage has probably been rewritten four times -- each version reflects what the team believed at that point).
The real power comes from compiling and cross-referencing across these sources. Your sales decks say one thing about your competitive positioning. Your call transcripts reveal what actually happens when a competitor comes up on a live call. Your email threads show how reps handle objections in writing. The intersection of these sources -- where they agree and where they diverge -- is where the deepest intelligence lives.
And then you interview the team on the front lines. Armed with patterns extracted from their own materials, you can ask sharper questions. Not "tell me about your customers" but "your decks show this pain appearing three times more often than that one -- is that intentional?" The extraction doesn't replace the human conversation. It makes it dramatically more productive.
What I'd Do Differently (The Honest Debrief)
Extract before interviewing. I conducted stakeholder interviews before running the document analysis. In hindsight, extracting signals from the presentations first would have made every interview sharper. I could have asked "your decks show pain A appearing 3x more often than pain B -- is that intentional?" instead of open-ended discovery questions. The extraction gives you a factual foundation that turns vague conversations into specific, evidence-based discussions.
Build the taxonomy first. We developed the categorization schema (pains, competitors, segments, capabilities) iteratively as we found patterns. Starting with a predefined taxonomy -- even a rough one -- would have accelerated the structured extraction phase significantly. You don't need the perfect taxonomy. You need a consistent one.
Don't underestimate the non-technical executive. The executive couldn't run the extraction pipeline, but he immediately understood the findings. His reaction to the messaging inconsistency data: "I knew we had this problem but I couldn't prove it." That reaction taught me something. The output of this work needs to be in a format a non-technical leader can act on -- not a database query, but a narrative with evidence. The extraction is technical. The delivery must not be.
Run it earlier in the engagement. Document extraction should be week one of any GTM consulting engagement. The presentations are the company's accumulated market intelligence -- distilled, curated, and battle-tested through real customer interactions. Starting with them gives you a foundation that every subsequent interview, analysis, and recommendation can build on. I now treat it as table stakes.
The Intelligence You Already Own
Most companies are sitting on years of accumulated sales intelligence locked in formats nobody can query. The vendors selling you external data are solving a real problem -- but they're solving the external half. The internal half -- what your team has learned, how your positioning has evolved, where your messaging has drifted -- is already on your shared drive.
You don't need a $50K platform to access it. You need an extraction pipeline, a consistent taxonomy, and the patience to let 47 documents tell you what your team has been learning for years without writing it down.
The patterns are already there. You just have to look.
Victor Sowers builds AI-native GTM systems at STEEPWORKS. 15 years scaling B2B SaaS, two exits, and 2.5 years of production AI-in-GTM.