title: "The ICP Scoring Pipeline: CRM Data to Ranked Accounts" slug: icp-scoring-pipeline seo_keyword: "ICP scoring pipeline" meta_description: "ICP scoring pipeline: from CRM data to ranked accounts. 10 weighted dimensions, worked scoring example, and the operating cadence that keeps it fresh." og_description: "A four-dimension ICP scoring pipeline that takes raw HubSpot data and produces ranked account lists in 20 minutes. Weighted formula, confidence scoring, negative signal overrides, and CRM write-back." cluster: ai-for-gtm author: Victor author_bio: "Victor Sowers builds AI-native GTM systems at STEEPWORKS. 15 years scaling B2B SaaS, two exits, and 2.5 years of production AI-in-GTM." status: published published_date: 2026-03-26 read_time_minutes: 14 description: "The ICP Scoring Pipeline: CRM Data to Ranked Accounts" domain: steepworks type: article updated: 2026-03-26
The ICP Scoring Pipeline: CRM Data to Ranked Accounts in 20 Minutes
A client's ICP was a 12-page PDF buried in a Google Drive folder. Beautifully formatted. Detailed personas. Their sales team had never opened it. When I asked the CRO how reps decided which accounts to pursue, he paused and said, "They just... know." They didn't know. They were guessing. The pipeline reflected it -- 35% of deals were zombies, close dates were fiction, and the top rep was outperforming the bottom rep 6:1 on poorly constructed territories.
ICP scoring is supposed to fix this. But most companies that attempt it end up with a strategy document, not a system. Gartner reports that only 42% of companies have a formally documented ICP. Documentation isn't the bottleneck. Operationalization is. Even companies with a written ICP rarely have a pipeline that takes raw CRM data and produces a ranked, tiered account list that reps can act on Monday morning.
The 2025 Ebsta x Pavilion GTM Benchmarks found that companies with structured account prioritization saw 28% shorter sales cycles. The top 14% of sellers generate 80% of revenue. ICP scoring is how you give the other 86% a map.
Most ICP scoring articles describe what to score -- firmographics, technographics, intent signals -- but skip the pipeline. They give you ingredients without a recipe. This article gives you the recipe: extraction, scoring formula, weights, tier assignment, confidence scoring, and CRM write-back. The whole pipeline runs in about 20 minutes on a 50-account list.
A note on timing, because "20 minutes" sounds like marketing copy if I don't qualify it:
| Account List Size | Approximate Pipeline Time |
|---|---|
| 50 accounts | ~20 minutes |
| 100 accounts | ~35 minutes |
| 200 accounts | ~60-75 minutes |
| 500+ accounts | Batch overnight; review in morning |
It scales roughly linearly. The point isn't absolute speed. It's that what used to be a quarterly project becomes a weekly cadence.
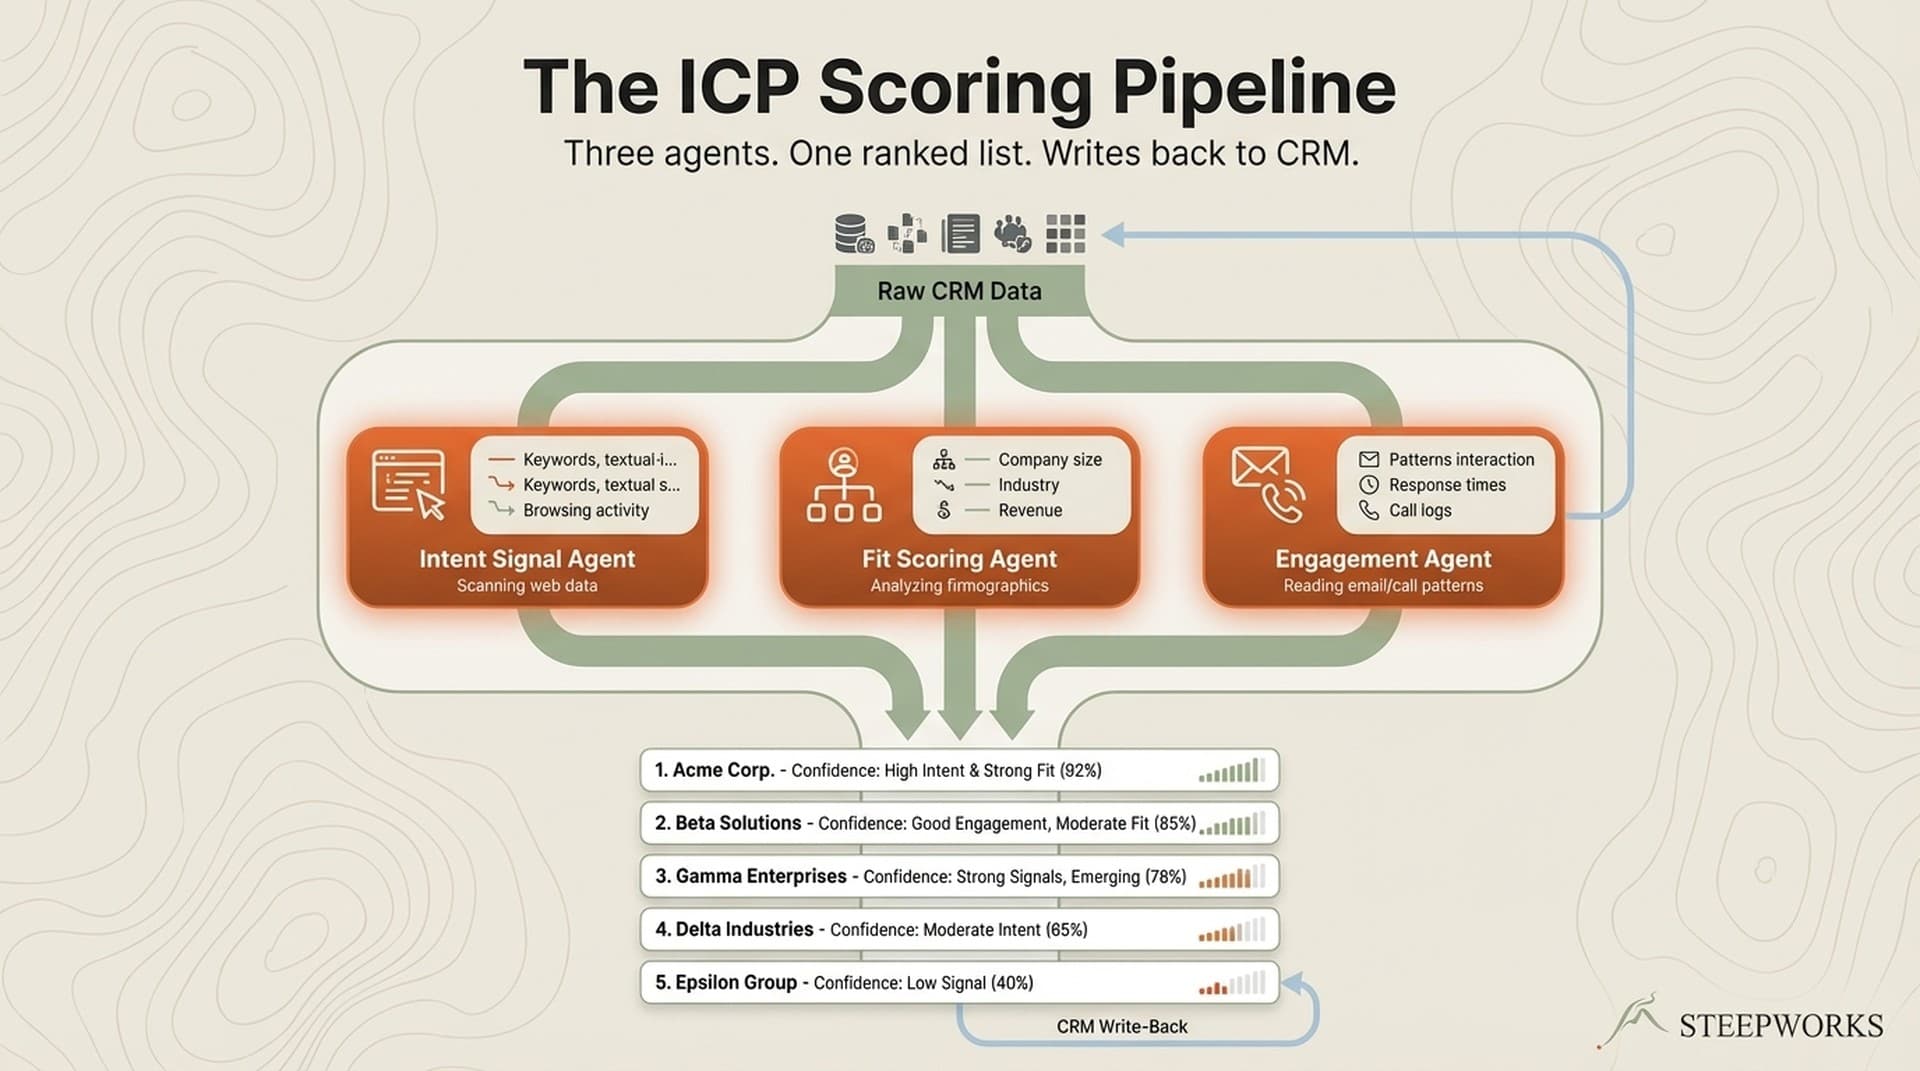
The Four Dimensions That Predict Fit
Most scoring models use too many variables. I've seen teams build 12-dimension models that take a week to populate and require a data engineer to maintain. Four dimensions, weighted correctly, outperform bloated models in every back-test I've run.
The formula:
Total_Score = (Firmographic x 0.4) + (Need x 0.3) + (Intent x 0.2) + (Timing x 0.1)
Each dimension scores independently on 0-100. The weighted total lands on 0-100. These weights are calibrated from scoring runs across multiple engagements. When I back-tested against closed-won deals, firmographic fit was consistently the strongest single predictor of conversion, followed by need. Intent and timing function as tiebreakers between similarly-fit accounts. Your data may differ -- the quarterly recalibration process later in this article exists specifically for tuning weights to your conversion patterns.
Firmographic Fit (Weight: 40%)
Firmographic fit measures structural match -- industry, company size (revenue and headcount), geography, ownership type, organizational indicators.
Why 40%: Firmographic fit is the hardest dimension to change. Wrong industry, wrong size, wrong geography rarely converts regardless of other signals. This is the foundation that everything else builds on.
Scoring rubric:
- 90-100: Ideal match (dead center of your ICP)
- 70-89: Good match (within range, minor deviation)
- 40-69: Marginal (adjacent, could work)
- 0-39: Disqualifying
Data sources: CRM company records, enrichment tools (revenue, headcount, industry codes), LinkedIn company pages, SEC filings for public companies.
One thing to watch: don't over-index on headcount alone. A 200-person company with $150M revenue operates very differently from a 200-person company at $20M. Revenue and headcount together tell the story. Either metric alone misleads.
Need Fit (Weight: 30%)
Need measures observable pain indicators -- job postings for roles your product addresses, public complaints or RFPs, technology gaps, industry-level pressure.
Why 30%: Need separates "nice to have" from "must have." A company with the right structural fit but no active pain is a future opportunity, not a current one.
Scoring approach:
- Direct pain evidence: +30 per signal (max 3)
- Indirect pain evidence: +15 per signal (max 3)
- Absence of capability: +20 per signal (max 2)
- Capped at 100
The signal most teams miss is job postings. A company hiring three or more people for the role your product replaces is telling you they have this problem. Job boards are the most underused intent source in B2B. They're free, public, and update daily.
Intent Fit (Weight: 20%)
Intent measures behavioral signals of active evaluation -- website visits, content engagement, third-party comparison shopping (G2, TrustRadius), social engagement, conference attendance.
Why 20%: Intent separates "aware of problem" from "actively looking for a solution." Valuable but noisy -- casual research generates false positives.
Default when data is missing: 30 out of 100. Absence of an intent signal is not absence of intent. Don't penalize accounts you simply haven't observed yet.
First-party signals (visited your pricing page) always outweigh third-party signals (appeared on a Bombora topic surge list). Weight accordingly.
If you have strong intent data: If you're running Bombora Company Surge, 6sense intent topics, or have robust first-party engagement data from marketing automation, increase Intent to 0.3 and reduce Firmographic to 0.3. Intent data is valuable; it's just not the default foundation. Companies with strong intent signals and bad firmographic fit still churn.
Timing Fit (Weight: 10%)
Timing measures decision cycle alignment -- budget cycles, fiscal year timing, regulatory deadlines, trigger events (new funding, leadership change, acquisition).
Why only 10%: Timing affects WHEN someone buys, not WHETHER they buy. A perfectly timed outreach to a bad-fit account is still wasted effort. Lowest weight because timing shifts but fit persists.
Default when data is missing: 50 out of 100 (neutral).
When to adjust the weights:
| Scenario | Adjustment | Rationale |
|---|---|---|
| High-velocity sales (cycles <30 days) | Intent 0.3, Firmographic 0.3 | Behavioral signals predict better in fast cycles |
| Enterprise sales (cycles >90 days) | Firmographic 0.5, Intent 0.1 | Structural fit dominates in long evaluations |
| Regulated industries | Timing 0.2, Need 0.2 | Regulatory deadlines create hard buying windows |
| Strong intent data source | Intent 0.3, Firmographic 0.3 | Dedicated intent data improves signal quality |
If You Already Have HubSpot Lead Scoring
This comes up in every conversation with RevOps teams, so I'll address it directly. HubSpot's native lead scoring is contact-level -- it scores individual people based on form fills, page views, and email opens. ICP scoring is account-level -- it scores companies as targets based on structural fit, pain signals, and timing. Lead scoring answers "is this person engaged?" ICP scoring answers "is this company worth pursuing?"
They're complementary, not competing. Run both. ICP scoring tells you which companies to focus on. Lead scoring tells you which contacts at those companies are most engaged. Together, they form a routing layer for both inbound and outbound.
The Pipeline -- Step by Step
The five steps below walk through the actual pipeline. I'm going to make the 20-minute claim verifiable, not aspirational, by breaking down where the time goes.
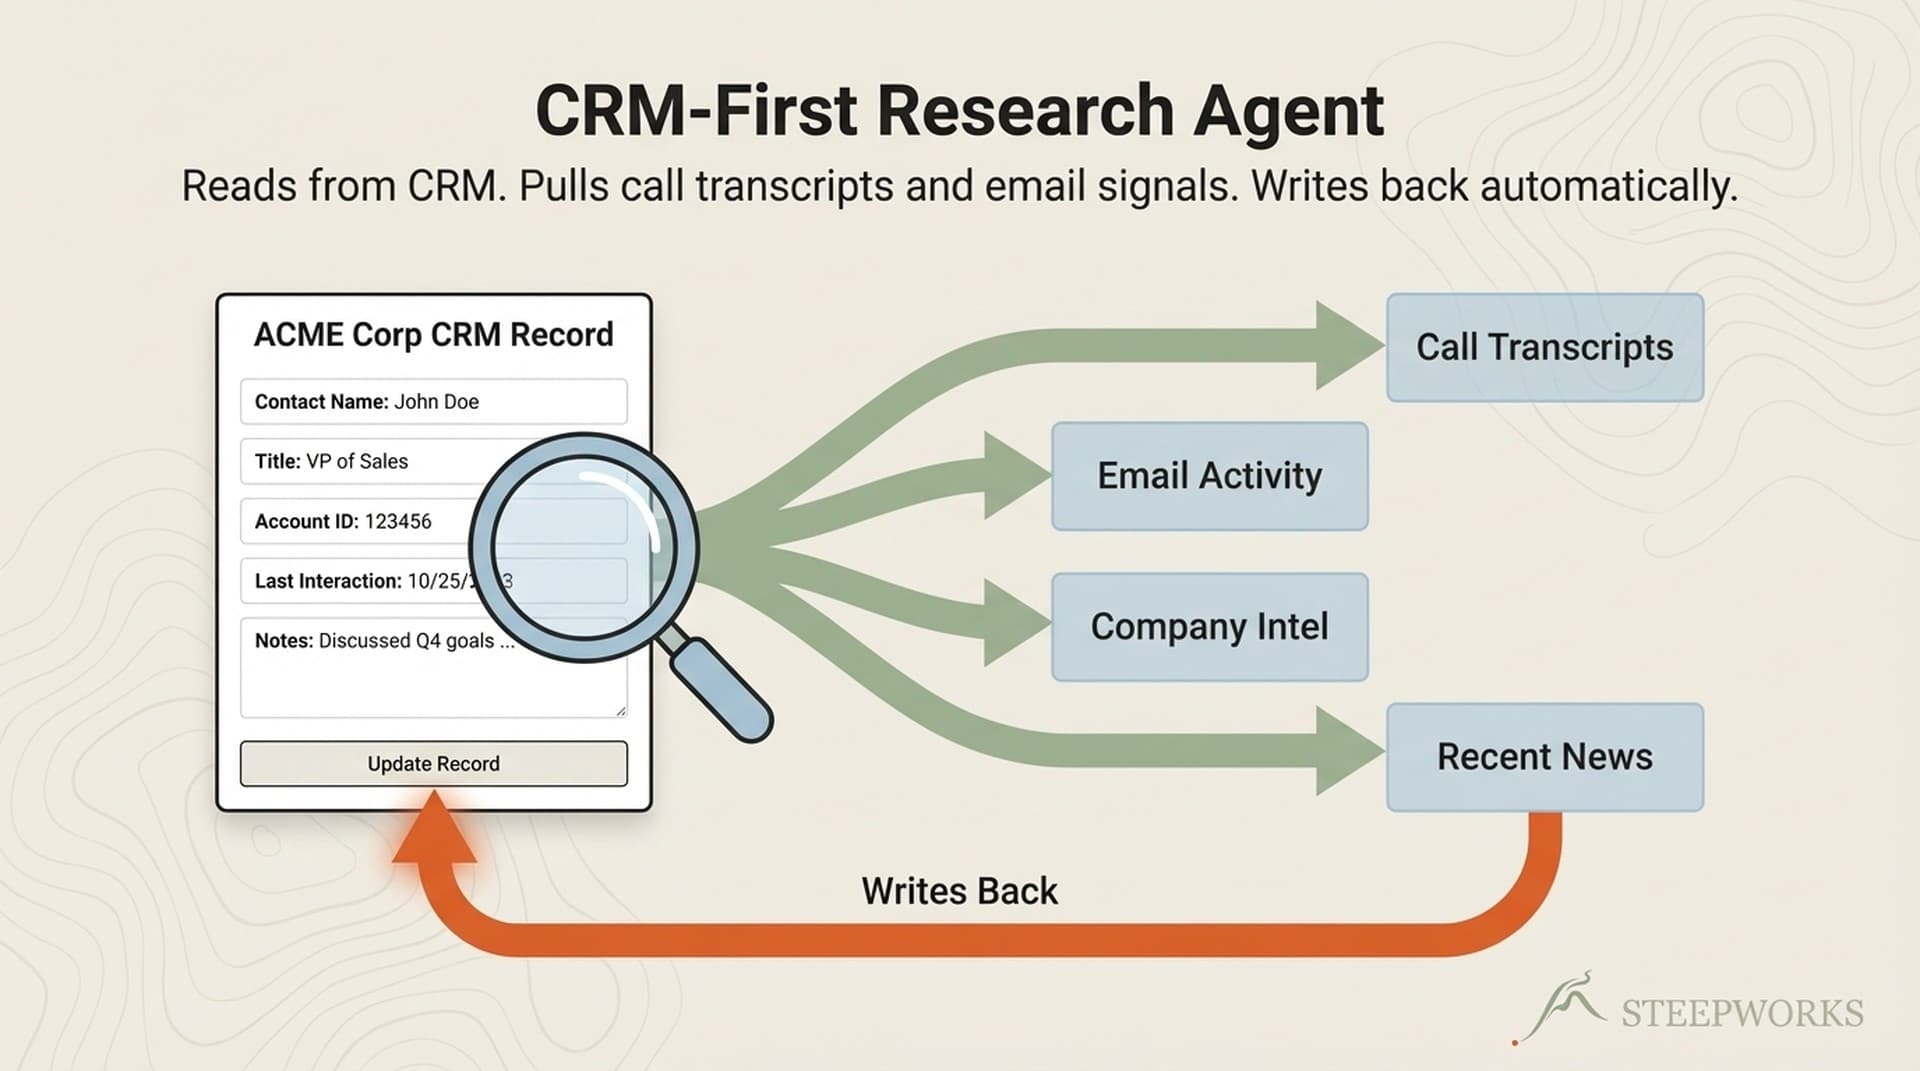
Step 1: Extract CRM Data (Minutes 1-3)
Pull all target companies from your CRM. The fields you need: company name, domain, industry, revenue, headcount, geography, ownership type, existing deal history, last activity date, contact count. For each company, pull associated contacts with job titles -- these feed the Need and Intent scoring.
On a 50-account list, this extraction takes 2-3 minutes depending on CRM API speed. HubSpot's batch endpoint handles 100 companies per request.
What to skip: don't pull every CRM property. Most companies have 50-200 company properties in their CRM. You need 8-12 for scoring. More data is not better data here -- it's slower processing and noise.
Step 2: Enrich What's Missing (Minutes 3-8)
CRM data is incomplete by nature. Run an enrichment pass for gaps: revenue (often missing for private companies), headcount, tech stack, recent funding events.
Use an enrichment waterfall approach: try the highest-confidence source first, fall back to secondary sources. Don't pay for data you already have.
The highest-signal enrichment step is free: job board scanning. Search for open roles at each company that match your need signals. A company hiring four engineers in a specialty you serve is a stronger pain indicator than most paid data points.
Cost reality: Enrichment at scale costs $0.15-0.50 per company depending on depth. For a 50-account scoring run, budget $10-25. This isn't a $50K enrichment platform commitment.
If your CRM data is sparse: If your revenue field is blank for 60% of companies, the enrichment step fills the gap. If enrichment can't find it either, the firmographic dimension scores with reduced confidence -- and that LOW confidence label shows up in the CRM write-back, signaling "investigate before acting." Absence of data is itself a signal. A company with no discoverable revenue data and no web presence probably isn't your T1 target. The system handles sparse data by scoring what exists and flagging what doesn't -- not by guessing.
Step 3: Score Each Dimension (Minutes 8-15)
Apply the four-dimension formula to each company. Each dimension scores independently on 0-100, then gets weighted.
Firmographic scoring is the fastest -- it's a lookup against your ICP criteria. Revenue in range? Industry match? Geography? Each criterion scores against the ideal/good/marginal/disqualifying rubric.
Need scoring requires the most judgment. You're interpreting signals: are those job postings indicative of pain you solve, or are they routine hiring? Is that RFP a real buying signal or a compliance exercise? This is where operator intuition still matters. The formula structures the thinking; it doesn't replace it.
Intent and Timing scoring happen in parallel. Both draw from enrichment data and public signals.
Step 4: Assign Tiers and Confidence (Minutes 15-18)
Apply tier thresholds:
| Tier | Score Range | Action |
|---|---|---|
| T1 (High Fit) | 80-100 | Immediate deep-dive and outreach. Priority account. |
| T2 (Good Fit) | 60-79 | Score and monitor. Outreach when timing aligns. |
| T3 (Marginal) | 40-59 | Monitor signals only. Low-priority. |
| DQ (Disqualified) | 0-39 | Remove from active lists. Do not pursue. |
Now the step most scoring systems skip entirely: confidence scoring. Every account gets a confidence level:
- HIGH: 4/4 dimensions have data, 3+ signals verified.
- MEDIUM: 3/4 dimensions have data, 1+ signal verified.
- LOW: 2/4 dimensions have data, no verified signals.
- INSUFFICIENT: <2 dimensions have data. Do not act on this score.
A Tier 1 account with LOW confidence is not the same as a Tier 1 with HIGH confidence. The confidence score tells you whether to act or investigate further. I've seen teams waste weeks pursuing "T1" accounts that were T1 only because the scoring system filled in optimistic defaults for missing data. Confidence scoring prevents that.
Step 5: Write Back to CRM (Minutes 18-20)
Write nine fields back to HubSpot for each company: (done-for-you implementation)
icp_score-- total (0-100)icp_tier-- T1/T2/T3/DQicp_firmographic-- (0-100)icp_need-- (0-100)icp_intent-- (0-100)icp_timing-- (0-100)icp_confidence-- HIGH/MED/LOWicp_scored_date-- dateicp_neg_signals-- multi-select
The write-back is what makes this a pipeline and not a spreadsheet exercise. Once scores live in the CRM, you can build workflows: (pricing tiers)
- "When
icp_tierchanges from T2 to T1, notify account owner and create a task." (See also: icp research pipeline) - "When
icp_confidenceis LOW, enroll company in enrichment workflow." (See also: ai gtm) - "When
icp_neg_signalsincludes 'competitor_locked', suppress from outreach sequences." (See also: icp model)
These workflows run automatically after every scoring cycle. The CRM becomes the execution layer, not just the storage layer.
Technical Lift: What You Need to Build This
| Level | What's Involved | Who Does It | Time |
|---|---|---|---|
| Low lift | Create 9 CRM properties, build tier-assignment workflows, create dashboard views by tier | RevOps person or HubSpot admin | Half a day |
| Medium lift | Connect an enrichment tool to fill data gaps; most tools have native HubSpot integrations | RevOps + enrichment tool account | 2-4 hours setup |
| Higher lift | Automate the scoring formula -- apply weights, run the calculation, write back scores programmatically | Technical operator or implementation partner | Days to weeks |
You can start with the low lift and score manually in a spreadsheet while building toward automation. The formula and weights are the intellectual work. The automation is plumbing.
Negative Signals: The Scores That Cap or Kill
This is the section most ICP scoring articles skip entirely. In my experience, the negative signal layer saves more rep time than the positive scoring layer does. Positive signals tell you who to pursue. Negative signals tell you who to stop pursuing. The second category is more valuable because it prevents wasted effort on accounts that look great on paper but can't convert.
Negative signals don't just reduce scores -- they override them:
| Negative Signal | Impact |
|---|---|
| Active competitor contract (2+ years remaining) | Cap total score at 59 (max T3) |
| Company in distress (layoffs >20%, bankruptcy filing) | Cap total score at 39 (auto-DQ) |
| Do-not-contact request | Score = 0 (auto-DQ) |
| Litigation or conflict of interest | Score = 0 (auto-DQ) |
| Previously churned (within 12 months) | Reduce total by 20 points |
| Bad-fit vertical (explicitly excluded from ICP) | Cap total score at 39 (auto-DQ) |
Why overrides instead of point deductions: a company can score 95 on firmographic fit, 90 on need, and still be a terrible target if they signed a 3-year contract with your competitor last month. Point deductions would still leave them as T1. The cap ensures they can't score above T3 regardless of positive signals.
How to detect negative signals: some live in your CRM already (churned accounts, do-not-contact flags). Others require enrichment or manual flagging (competitor contracts, distress signals). Build the detection into your enrichment step -- don't bolt it on after scoring. The negative signal check should run before tier assignment, not after.
What Most ICP Scoring Gets Wrong
Differentiation in scoring isn't about what you include. It's about what you ignore. Here are five data points I've seen teams weight in their scoring models that predict nothing:
Social media follower counts. A company's LinkedIn presence tells you about their marketing team, not their buying intent. I've seen scoring models weight social followers as a firmographic signal. It's noise.
Website traffic estimates. SimilarWeb rankings correlate with brand awareness, not with whether a company needs your product. A company with 10x your traffic isn't 10x more likely to buy.
Raw headcount without revenue. Five hundred employees at a $30M company and 500 employees at a $300M company are not comparable prospects. Headcount alone is one of the most common over-indexed signals in scoring models I've audited.
Technology stack without context. Knowing a company uses Salesforce tells you they have a CRM. It doesn't tell you whether they need yours. Tech stack matters only when specific technologies indicate a pain you solve or a stack gap you fill. Generic "uses these tools" data adds columns without adding signal.
Isolated page views. Someone hit your blog from a Google search. That's not intent. Intent is when they hit the pricing page, then the integrations page, then came back two days later. Behavioral sequences matter; isolated page views don't.
The filtering principle: every scoring dimension you add has a signal-to-noise ratio. If a data point doesn't correlate with historical conversions when you back-test it, remove it. A leaner model with four high-signal dimensions outperforms a bloated model with twelve mixed-signal dimensions. I've tested this repeatedly. Fewer dimensions, better weights, higher accuracy.
Worked Example: Scoring One Account End to End
Let me walk through a single account from raw data to tier assignment. This is anonymized from a real scoring run for a PE-backed industrial company.
Company: Industrial Controls Corp (anonymized) Raw CRM data: Company record in HubSpot with partial data -- revenue field blank, industry set to "Manufacturing," 150 employees, HQ in the Midwest.
Step by step through the pipeline:
CRM extraction: Pulled the company record. Found 2 associated contacts (both engineering titles). Last deal activity: 45 days ago. No open deals.
Enrichment: Revenue estimated at $75M via enrichment provider. Ownership identified as PE-backed. Tech stack includes legacy systems being replaced. Four open roles for a specialty engineering function the client serves.
Scoring:
| Dimension | Score | Evidence |
|---|---|---|
| Firmographic (x0.4) | 88 | $75M revenue (ideal range), 150 employees, target vertical, PE-owned |
| Need (x0.3) | 82 | 4 open roles in target specialty (+30), technology transition underway (+30), no internal team for the capability (+20), capped at 80, +2 from indirect signals |
| Intent (x0.2) | 55 | Attended industry conference (+15), posted RFP for relevant partner (+30), baseline default adjusted |
| Timing (x0.1) | 70 | Government contract with 9-month deadline (+30), fiscal year starts Q1 (+40) |
Calculation:
Total = (88 x 0.4) + (82 x 0.3) + (55 x 0.2) + (70 x 0.1)
      = 35.2 + 24.6 + 11.0 + 7.0
      = 77.8
Tier assignment: T2 (Good Fit) -- Score 78.
Confidence: MEDIUM -- 4/4 dimensions have data, but only 2 signals are multi-source verified.
Negative signal check: No competitor lock-in detected. No distress signals. No overrides applied.
Recommendation: Priority monitor. Strong firmographic and need fit. Intent is moderate. Deep-dive when intent signal strengthens -- a follow-up conference engagement or direct website visit would push this toward T1.
CRM write-back: All nine fields populated in HubSpot. Account added to T2 monitoring workflow.
Why this example matters: the company would have been invisible in a firmographic-only scoring model. Manufacturing, mid-market -- broad match, low priority in a simple filter. The need signal -- four specialty hires plus a technology transition -- is what elevates it. Multi-dimensional scoring surfaces accounts that single-dimension models miss.
From One-Off Exercise to Operating Cadence
Most scoring articles treat ICP scoring as a project. Score once, build a list, hand it to sales, move on. That's how scoring systems die. The list goes stale within weeks, and reps stop trusting it.
ICP scoring is a process, not a project. Here's how to build it into a rhythm.
Scoring cadence by dimension:
| Dimension | Recommended Refresh | Rationale |
|---|---|---|
| Firmographic | Quarterly | Structural attributes change slowly. Annual would be fine for most. |
| Need | Monthly | Pain signals evolve -- new hires, new projects, regulatory shifts. Monthly catches the important shifts. |
| Intent | Weekly (if data source allows) | Intent is perishable. A conference visit from 8 weeks ago isn't intent anymore. |
| Timing | Monthly | Budget cycles, fiscal years, trigger events. Monthly is sufficient. |
Signal decay: If an intent signal hasn't updated in 14 days, decay the score by 15% weekly. Stale intent is worse than no intent -- it creates false confidence. I've seen teams leave intent scores untouched for months. By that point the score is measuring history, not opportunity.
Re-scoring triggers: Don't wait for the cadence cycle if something material changes. A leadership change, a funding announcement, or a competitor loss should trigger an immediate re-score.
The compound effect: Each scoring run adds data to the CRM. Over time, your model self-calibrates. You can back-test: "Of the 20 accounts we scored T1 in Q1, how many converted?" If T1 conversion is below 30%, your weights or thresholds need adjustment. If T1 conversion is above 50%, your model is working -- tighten the criteria to surface even higher-fit accounts.
Quarterly weight recalibration: Markets and products shift. A weight set that worked in Q1 may need adjustment by Q3. Recalibrate weights based on actual conversion data, not assumptions. This is where the scoring system gets better over time instead of decaying.
Inbound Teams: This Applies to You Too
If you run an inbound-led motion, ICP scoring is your routing layer. Not every demo request deserves the same response speed. Score the company behind the inbound lead, and route T1 companies to immediate human response, T2 to same-day follow-up, and T3 to automated nurture.
The pipeline works upstream of both inbound routing and outbound targeting. If Marketing sources 40% of pipeline, but half of those companies score T3 or DQ on firmographic fit, that pipeline contribution number needs a reality check. ICP scoring gives Marketing and Sales a shared language for "quality."
For how I built the ICP definition that feeds this scoring pipeline, see The ICP Development Process I Used for a PE-Backed Manufacturer.
What This Pipeline Doesn't Replace
Honest scoping matters. Here's what this system is not:
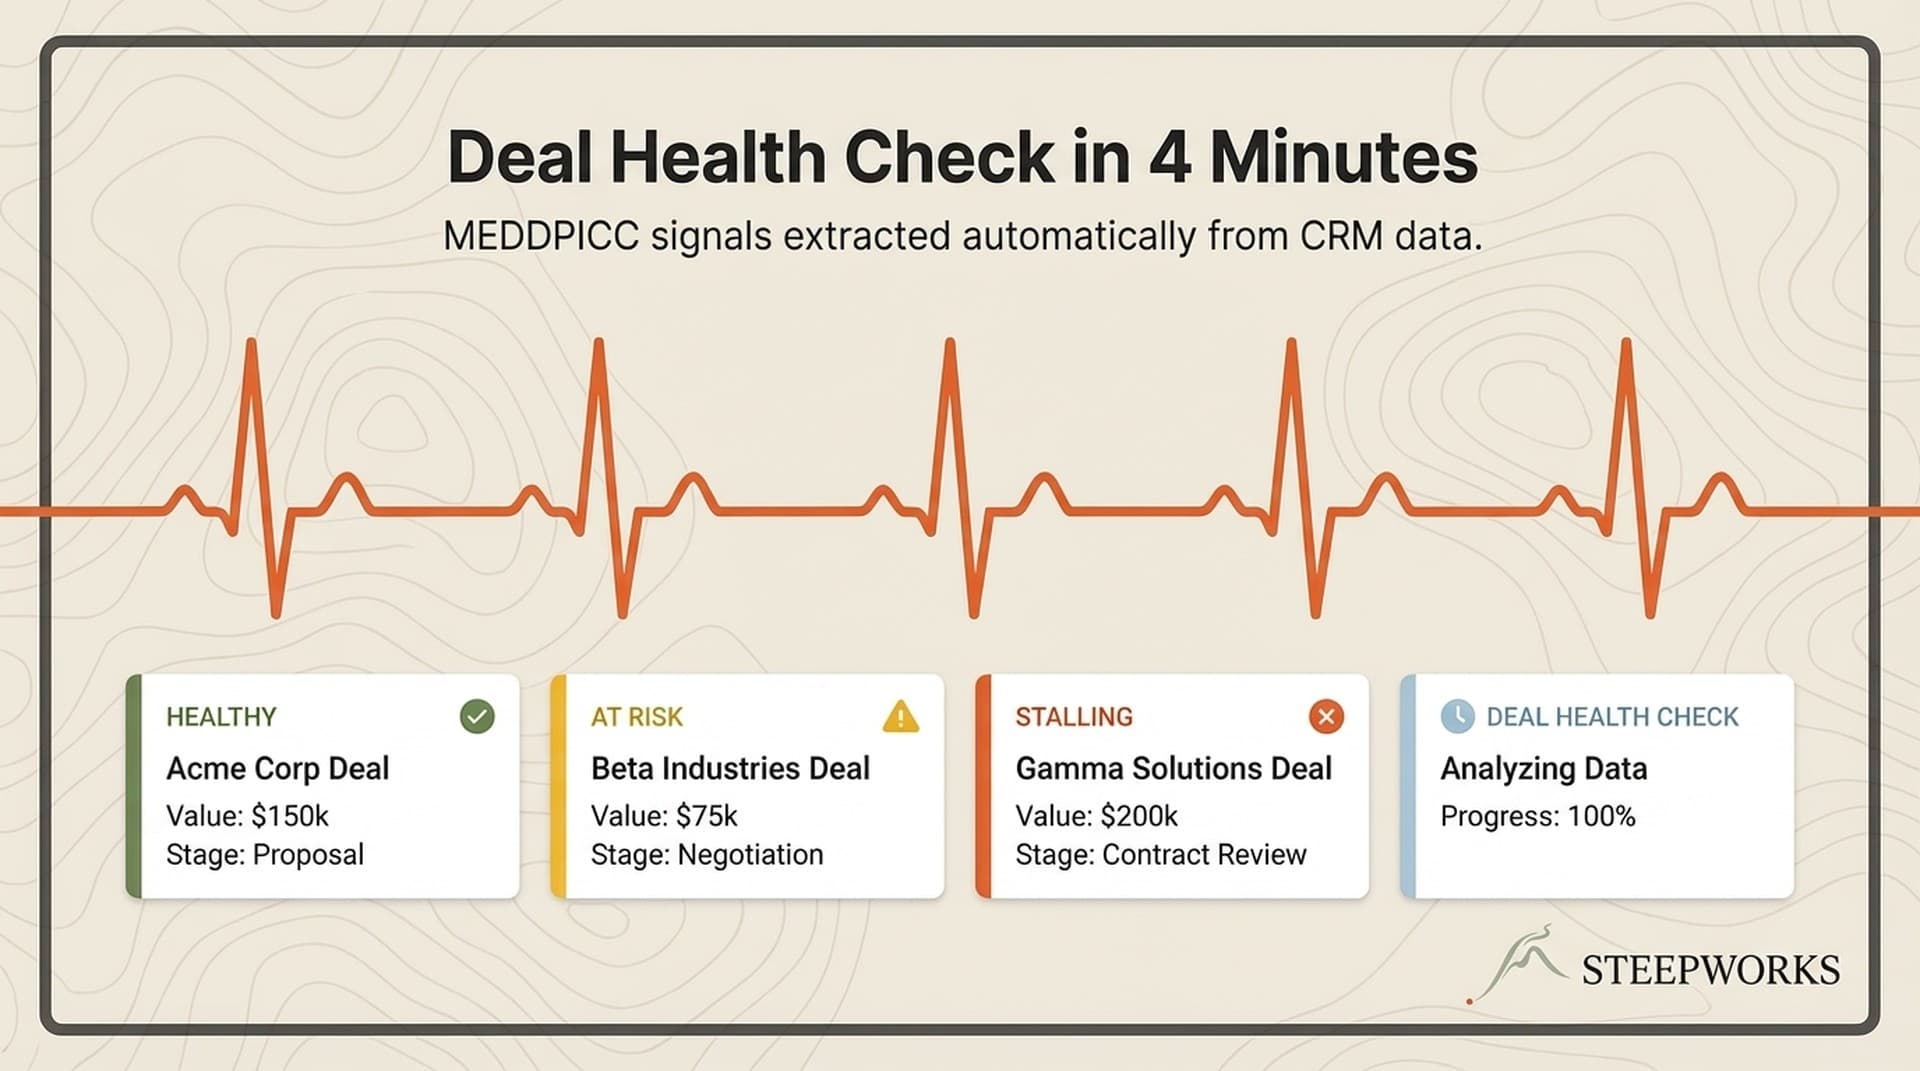
It doesn't replace deep prospect research. A T1 score tells you the account is worth pursuing -- it doesn't tell you what to say. Deep research is the next step after scoring identifies the target. For how that looks in practice, see the deal health check system I built for a similar RevOps workflow.
It doesn't replace sales judgment. The pipeline surfaces data; humans interpret context. A T2 account with a warm introduction from a board member is worth more than a T1 account with no relationship path. Scoring handles the 80% of accounts where judgment alone would be guessing. For the other 20%, trust your team.
It doesn't replace intent data platforms. If you have budget for Bombora, 6sense, or similar, those platforms feed richer intent signals INTO this pipeline. They're complementary, not competing.
Build vs. buy context: If you have $40-80K/year for a platform like 6sense or Demandbase, they handle scoring plus intent plus orchestration. This pipeline approach makes sense for teams under $10M ARR, solo operators, or anyone who wants to understand what those platforms do under the hood before committing budget.
Where to go next:
- T1 accounts go to deep-dive research -- company dossier, contact mapping, competitive positioning
- T2 accounts go to monitoring workflows -- watch for signal changes that would promote to T1
- T3 accounts go to nurture -- automated, low-touch
- DQ accounts get removed from active lists entirely
For how the full AI-native GTM stack connects -- enrichment, scoring, research, outreach -- see The AI GTM Stack I Actually Use.
ICP scoring isn't a strategy exercise. It's a pipeline -- extraction, enrichment, formula, tiers, write-back. Run it like one and your reps stop guessing which accounts to call. That's not a productivity gain. That's the difference between a sales team that hunts and one that wanders.